Silver has long been known for its volatility and strong performance during economic uncertainty. With today’s dramatic climb of the spot silver price over $33.29 per ounce before being tamped down, many investors wonder whether Silver could climb to $100 per ounce in the coming years.
While this price target may seem ambitious, since 2020, the price of gold has risen more than 96.4%. History and current market trends suggest that under the right conditions, the price of silver could explode.
Several key factors drive price of the shiny metal, including monetary policy, industrial demand, supply constraints, and macroeconomic uncertainty. A better understanding of these variables can help investors see whether Silver could experience another parabolic rise, like in 1980 and 2011, when Silver nearly reached $50 per ounce.
Why Silver Could Surge to $100 per Ounce
History shows a strong correlation between inflationary periods, loose monetary policy, and rising silver prices—particularly when gold enters a bull market. The 2008-2010 Housing Bubble and the subsequent Great Recession clearly exemplify how Silver reacts to economic uncertainty, inflation fears, and Federal Reserve intervention.

During the aftermath of the 2008 financial crisis, the Fed implemented near-zero interest rates, quantitative easing (QE), and massive money printing to prop up the economy. These policies devalued the U.S. dollar and sparked a flight to gold and Silver.
- Gold began its bull run in late 2008, rising from $700 to over $1,900 per ounce by 2011.
- Silver followed gold’s lead but outperformed it in percentage terms, surging from around $9 per ounce in 2008 to nearly $50 per ounce in April 2011.
- The gold-to-silver ratio dropped from over 80:1 in 2008 to nearly 30:1 in 2011, reflecting Silver’s tendency to outperform gold during inflationary bull markets.
The Federal Reserve’s potential rate cuts in 2025 could reignite inflation, weaken the U.S. dollar, and drive investors toward hard assets like Silver.
Accelerating Industrial Demand
Beyond an investment, 50% of the demand for Silver comes from industry. The rise of solar energy, electric vehicles, and AI-driven computing drives demand.
Silver is a crucial component in photovoltaic cells. Industry analysts forecast global solar demand to grow at a 12.7% compound annual growth rate from 2025 to 2030.
Silver’s conductivity and thermal properties make it ideal for use in semiconductors and electronics of all types, including EV batteries and charging stations.
The Growing Silver Supply Deficit
The silver market has been in a structural deficit for several years, with demand outpacing new mine supply.
While the Silver Institute expects a deficit reduction, the eroding confidence in the LBMA could push silver prices significantly higher, similar to the gold bull markets of the 1970s and 2000s.
“Silver Squeeze” in the Futures Market
Given LBMA gold liquidity crisis, silver investors and industrial consumers are likely to begin demanding physical delivery on futures contracts.
The LBMA’s delays are reportedly extending to 4–8 weeks, constituting a technical default on contracts that specify prompt delivery.
The ongoing attacks on the LBMA vaults highlight the discrepancy between paper gold and available physical gold. With 96% of daily traded gold having no physical backing, the market’s reliance on paper transactions is now under scrutiny.
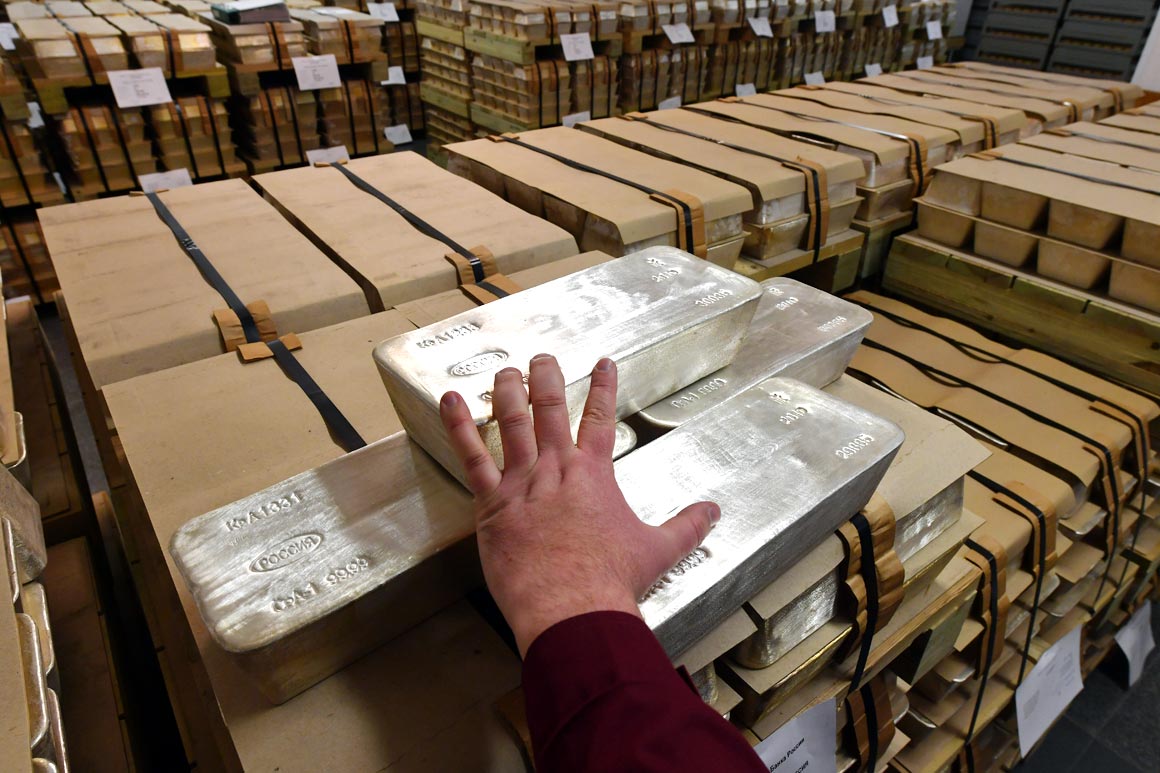
With the supply of 1000 oz silver bars currently dwindling in the COMEX and LBMA vaults, a sudden surge in demand for physical delivery due to tariff concerns, leading to a squeeze on domestic supplies, driving Silver Prices even higher.
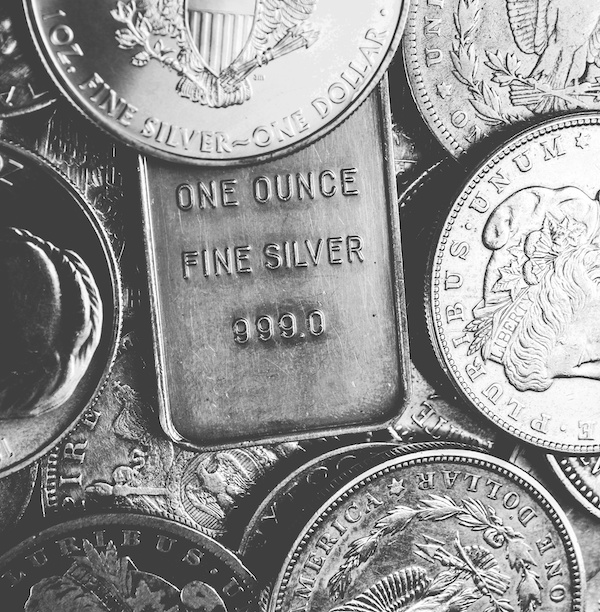
Dealer premiums have dropped significantly in recent weeks to as low as 55 cents per oz over the spot price for 100 oz silver bars, while 10 oz silver bars are trading as low as $1.20/oz over spot. Premiums will likely rise once retail investors take notice and jump into the silver squeeze.
High Gold-Silver Ratio
Historically, the gold-to-silver ratio has averaged 60:1. Today, it is around 89:1, suggesting that we’re already beyond the 80/50 rule of thumb and could quickly rise toward the all-time high of over 125:1 set in March 2020 at the start of the COVID-19 Crisis.
If gold rises to $3,000 per ounce, returning to a 60:1 gold-silver ratio would put Silver at $50 per ounce.
Challenges to Silver Reaching $100
While the long-term case for Silver remains strong, challenges could slow or prevent a move to $100 per ounce.
Silver’s price could struggle to break higher levels if the Federal Reserve delays or reverses rate cuts.
The likelihood of a global recession seems unlikely, with odds around 25% in prediction markets, suggesting a more optimistic outlook. However, other factors can impact industrial demand, such as the recent drop in iPhone sales, which suggests the consumer market may be oversaturated.
LBMA Market Manipulation Scandal
Rumors have been floating around for decades that COMEX and LBMA encourage excessive short-selling or coordinated actions like price spoofing or flooding the market with paper contracts to drive prices down.
The media was quick to memory-hole the LBMA scandal involving JP Morgan Chase Bank executives convicted of market manipulation, one of whom being an active LBMA board member at the time of conviction.
While those convictions occurred in 2019, the investigation began in 2008 but was dropped due to insufficient evidence. Is it possible the CFTC ignored the price manipulation due to political pressures from above? Time will tell.
Will Silver Hit $100? A Timeline Projection
If Silver follows historical patterns, reaching $100 per ounce is possible within the next five years if a combination of factors occurs: a continued supply deficit and declining mine output combined with strong industrial demand from solar, EVs, and AI technologies, a break in market manipulation, and increased retail investor demand.
Possible Timeline Scenarios
| Year | Potential Silver Price Drivers | Estimated Price Range |
|---|---|---|
| 2025 | Fed rate cuts, gold bull market begins | $40 – $50 |
| 2026 | Gold-silver ratio narrows, industrial demand rises | $50 – $65 |
| 2027 | Supply deficit worsens, investor demand grows | $65 – $80 |
| 2028-2030 | Major breakout, silver reaches new highs | $80 – $100+ |
Preparing for Higher Silver Prices
For investors, $100 silver may be coming down the road. In the meantime, the cost of silver will likely continue to rise as the gold bull market kicks off. When the silver price per ounce reaches $100, each 100 oz of silver will be worth $10,000. With dealer premiums currently at multi-year lows, now is an excellent time for investors to accumulate, focusing on low-premium 1 oz silver coins.


