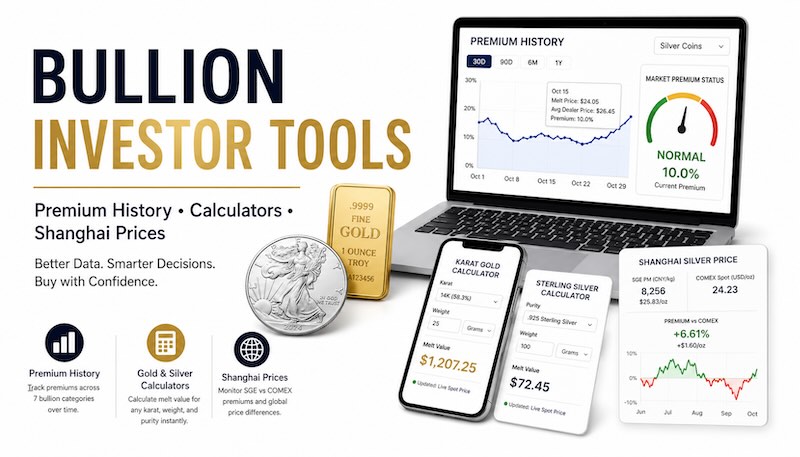
We built FindBullionPrices to help you find the lowest prices on gold and silver from trusted online dealers. But knowing today’s lowest price is only part of the picture. Are premiums high or low right now? What’s a 14k gold bracelet actually worth at today’s spot price? And what’s happening with silver pricing in Shanghai, where physical delivery requirements tell a different story than COMEX futures?
We recently launched three new tools that answer those questions. Here’s what they do and how to use them.
Bullion Premium History Charts
When you shop for bullion, the price you pay has two parts: the underlying metal value (spot price) and the dealer premium on top. Spot prices are widely available, but premium data over time has always been hard to find. That changes with our new Premium History section.
We track nightly premium snapshots across seven bullion categories: silver coins, silver bars, gold coins, gold bars, junk silver, platinum coins, and platinum bars. For each product, we calculate the premium as the percentage difference between the average lowest dealer price and the melt value (spot price times troy ounces).
What you can do with premium history
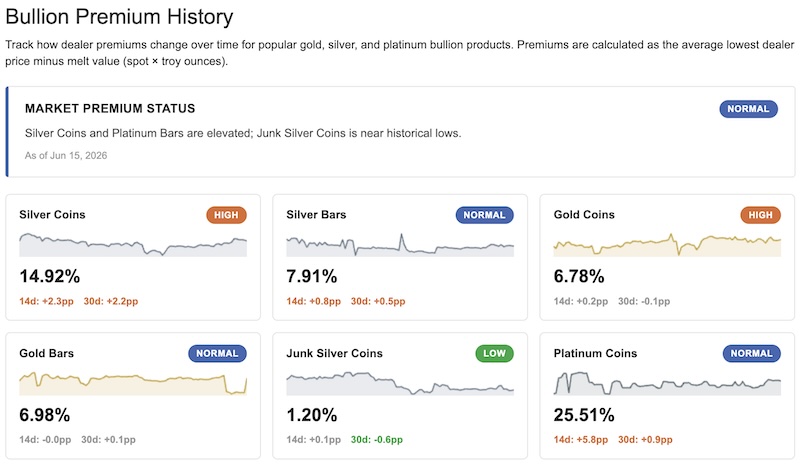
The premium history hub shows an overall Market Premium Status badge at the top, with each category card carrying its own HIGH, NORMAL, or LOW indicator so you can see at a glance where premiums stand. Each card also includes a chart, the current premium percentage, and 14-day and 30-day trend indicators measured in percentage points.
Drill into any category to see interactive charts with 1-month, 3-month, 6-month, 1-year, and 5-year timeframes. Hover over any point to see that day’s melt price, average dealer price, and average premium percentage. You can also filter by weight, mint, or country to compare premiums across similar products.
Why this matters for buyers
Premiums fluctuate based on supply chain conditions, seasonal demand, and market events. During the early 2021 silver squeeze, premiums on American Silver Eagles spiked above 100%. In quieter periods, they can drop to single digits. Knowing where premiums sit relative to their recent range helps you decide whether to buy now or wait.
For example, if the 30-day trend for silver bars shows premiums falling while spot is flat, that tells you dealer supply is catching up with demand. If premiums are rising while spot drops, retail demand is absorbing the spot decline and your effective savings may be smaller than the headline price suggests.
Gold and Silver Calculators
Our new calculators hub includes two tools designed for people who own precious metals in forms other than standard bullion.
Karat Gold Calculator
The gold price per gram calculator tells you what your gold jewelry, dental gold, or scrap gold is worth at today’s spot price. Select the karat (10k, 14k, 18k, 22k, and 24k, plus 9k and 21k), enter the weight in grams, troy ounces, pennyweight, or avoirdupois ounces, and the calculator shows the melt value instantly.
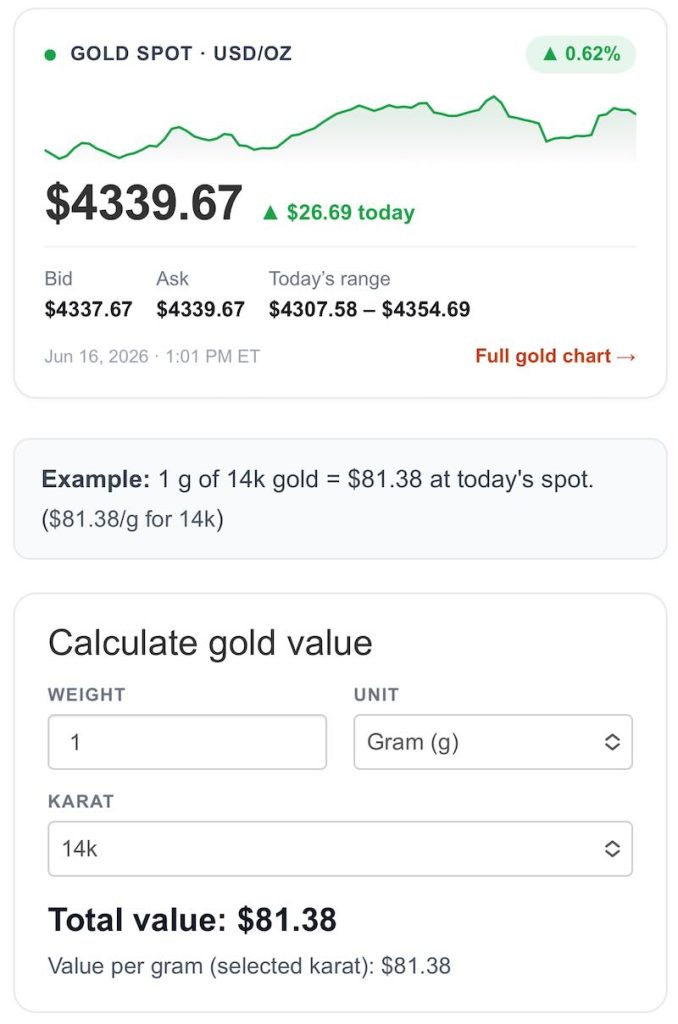
The page also includes a quick-reference table with today’s gold value per gram for the most common jewelry purities: 10k, 14k, and 18k. If you’re evaluating an estate purchase or trying to figure out what a pawn shop should be offering, this gives you a baseline.
Sterling Silver Calculator
The sterling silver calculator works the same way but for silver items. What sets it apart is that it handles six purity levels, not just .925 sterling. You can calculate values for .999 fine silver, .958 Britannia silver, .925 sterling, .900 coin silver, and the less common .835 and .800 purities often found in European flatware and antique silver.
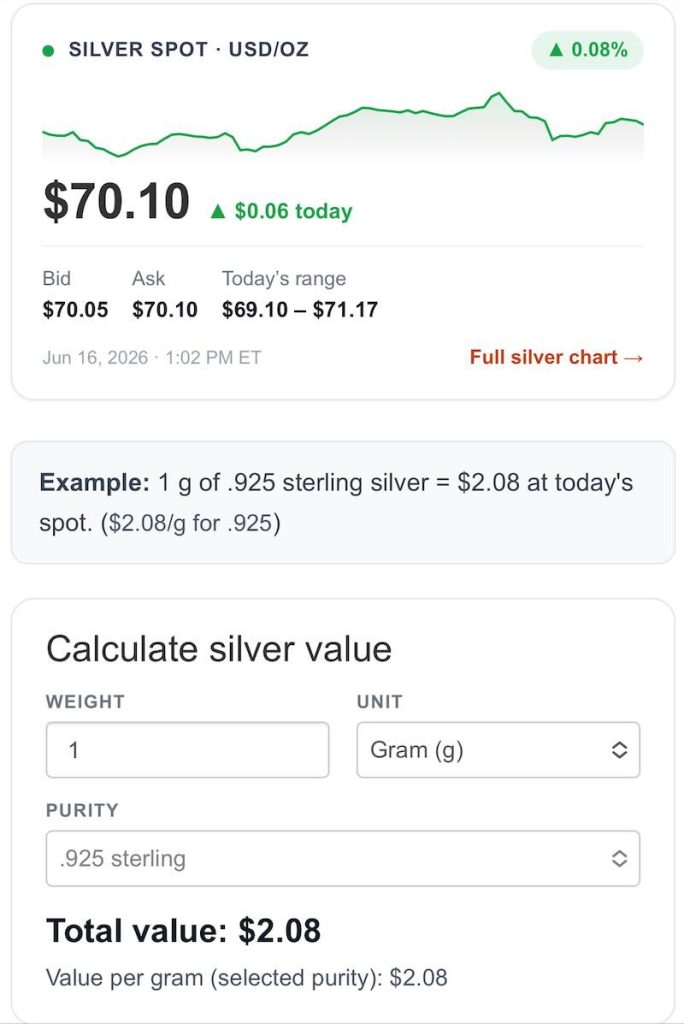
Enter the weight of your silver item, select the purity, and the calculator returns the melt value using live spot prices that update throughout the day.
Connecting calculators to real dealer prices
Both calculators link directly to our dealer comparison pages, so after you see what your gold or silver is worth at melt, you can check what dealers are actually charging or offering. The gap between melt value and dealer price is where the market lives, and having both numbers in front of you helps whether you’re buying or selling.
Shanghai Gold and Silver Price Tracking
Most bullion price sites show you one number: the COMEX spot price. But gold and silver trade on multiple exchanges around the world, and the price differences between them carry real information about physical supply and demand.
Our enhanced Shanghai silver price and Shanghai gold price pages track the Shanghai Gold Exchange (SGE) daily fixing benchmarks alongside COMEX spot prices, showing the premium or discount between East and West in real time.
What the Shanghai pages show
Each page displays the SGE’s morning (AM) and afternoon (PM) benchmark prices in both Chinese yuan (per kilogram for silver, per gram for gold) and converted to USD per troy ounce. The premium versus COMEX is calculated for both sessions and shown as a percentage.
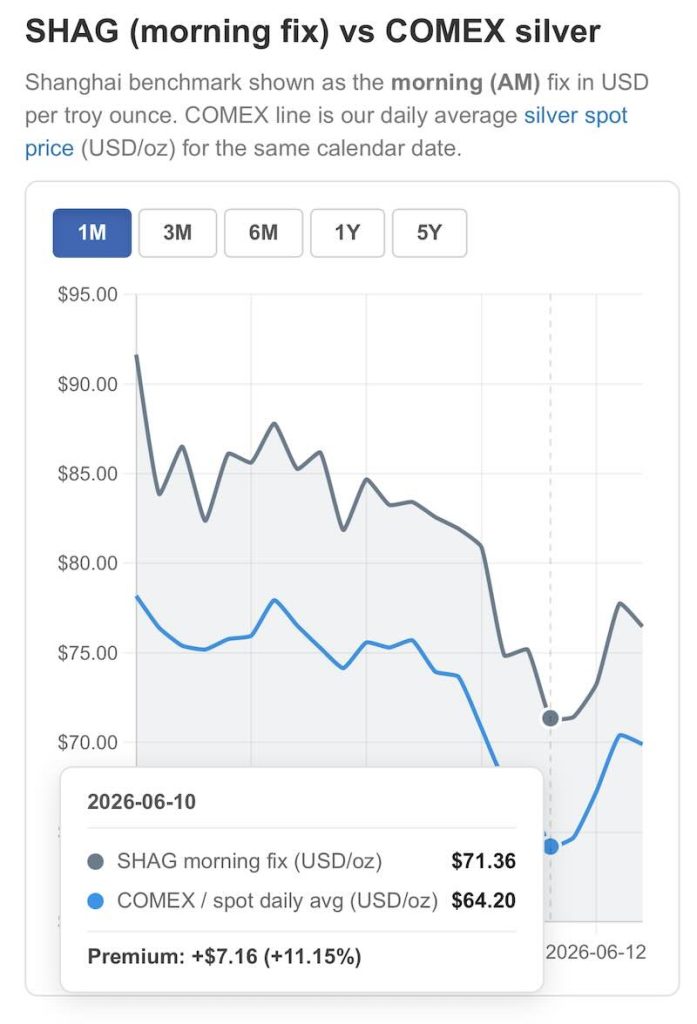
Two interactive charts give you the full picture. A premium history chart uses green and red shading to show periods when Shanghai traded above or below Western benchmarks, with selectable timeframes from 1 month to 5 years. A second chart overlays the SGE benchmark price (morning fix) against the same-day COMEX average, so you can see the two markets side by side.
A 30-trading-day data table at the bottom of each page shows every benchmark value and premium calculation in detail. The silver page also includes a worked example of China’s 13% VAT on silver and how it raises the all-in delivered cost for Chinese buyers compared to the pre-tax SHAG-vs-COMEX premium shown in the charts.
Why Shanghai premiums matter
The Shanghai Gold Exchange is the world’s largest physical gold exchange, and unlike COMEX (where most contracts are cash-settled), SGE contracts require physical delivery. When the Shanghai premium runs high, it signals strong physical demand in China that isn’t fully reflected in Western futures prices.
For U.S. bullion buyers, persistent Shanghai premiums can be a leading indicator of tighter physical supply. When Chinese industrial and investment demand pushes Shanghai gold prices well above COMEX, it puts pressure on global inventories. That upstream tightening eventually shows up in the dealer premiums you see on our silver and gold comparison pages.
Each page includes a side-by-side comparison table showing how SGE and COMEX differ on settlement method, contract units, trading hours, regulators, import controls, VAT treatment, and inventory reporting.
What’s Next
These three tools join our existing spot prices hub, dealer comparison pages, and silver coin melt value calculator as part of an ongoing effort to give bullion buyers the data they need to make better purchasing decisions.
We have more calculators and tools in development. If there’s a specific tool or data point you’d find useful, let us know.


")

