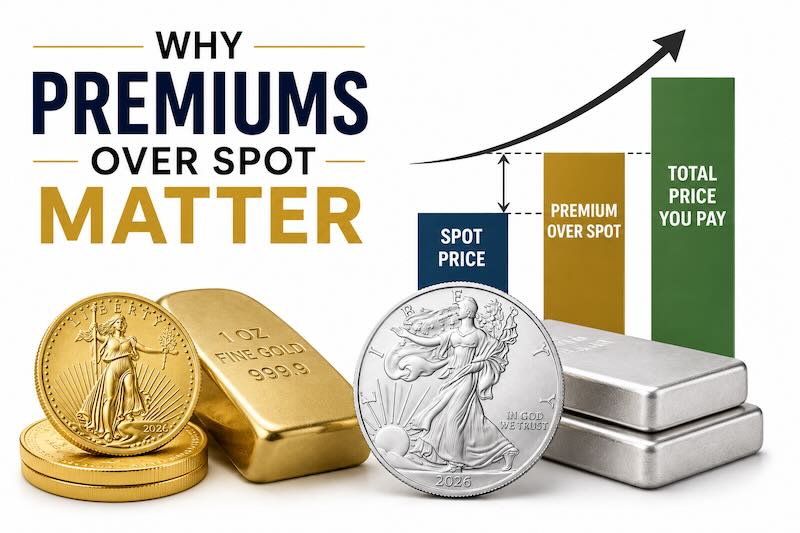
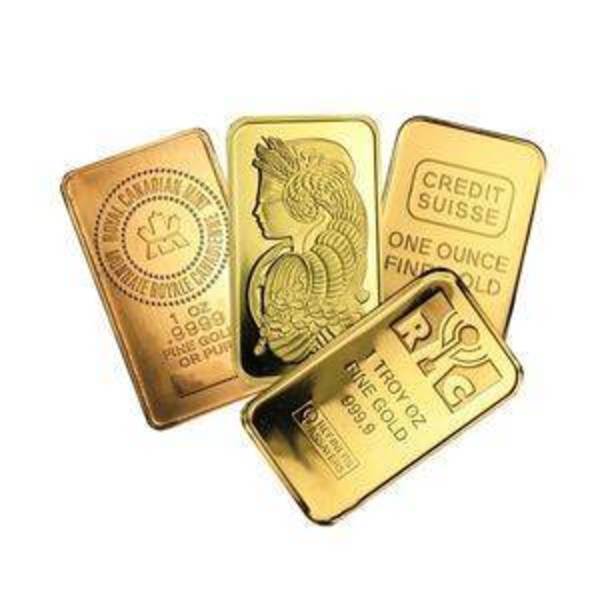
Gold spot is $4,115.21 right now. But you can’t buy an ounce of gold for $4,115.21. The lowest-priced 1 oz American Gold Eagle available today costs $4,253.43. That $138.22 difference — 3.32% above spot — is the premium over spot. It is the gap between the theoretical price of the metal and the real price you pay to hold it in your hand. If you buy bullion without paying attention to that gap, you are making decisions with incomplete information.
Spot price tells you what gold or silver is worth on the commodities market. Premium tells you what it costs to actually own it. For anyone buying physical metal, premium is the number that determines your true entry price.
What Premium Over Spot Means
Premium over spot is the dollar or percentage markup above the melt value of a bullion product. Melt value is simple math: the current spot price of the metal multiplied by the troy ounces of pure metal in the product. A 1 oz gold coin with .9999 fine gold has a melt value equal to the spot price. A 90% silver quarter with 0.1808 troy ounces of silver has a melt value of $10.90 at today’s $60.30 silver spot.
Premium is what sits on top of that melt value. In dollar terms: retail price minus melt value. In percentage terms: that dollar difference divided by the melt value, times 100. A 1 oz gold bar selling for $4,284.59 carries a $169.38 premium, or 4.07%. A 1 oz Silver Eagle at $69.99 carries a $9.69 premium, or 15.63%.
Every physical bullion product has a premium — gold coins, silver bars, platinum rounds, bags of pre-1965 junk silver. There is no way to buy physical metal at spot price. The question is never whether you’ll pay a premium, but how much of one.
Why Premiums Exist: The Supply Chain
A gold or silver bar doesn’t teleport from the ground into your safe. It moves through a chain of businesses, and each one adds cost.
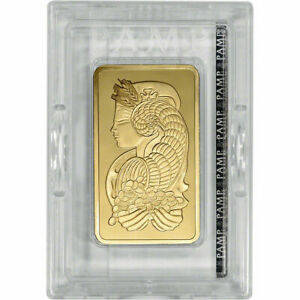
It starts at the mine. Raw ore is extracted, processed, and refined into .999 or .9999 fine metal. Refiners like PAMP Suisse, Valcambi, and the Royal Canadian Mint charge fabrication fees to turn refined metal into bars, coins, and rounds. These fees cover the cost of minting, assaying, packaging, and quality control. A PAMP 1 oz gold bar costs more to produce than a generic 100 oz bar because the per-unit handling and packaging cost is higher relative to the metal content.
For US Mint products, the chain has an extra link. The Mint does not sell directly to the public. It sells to a network of authorized purchasers — large distributors who commit to buying in bulk. The Mint’s wholesale markup is public: 3% above spot for 1 oz Gold Eagles, 5% for 1/2 oz, 7% for 1/4 oz, and 9% for 1/10 oz. For Silver Eagles, the Mint has raised its wholesale premium multiple times in recent years, and that cost gets passed downstream. Those authorized purchasers then sell to retail dealers, adding their own margin.
Retail dealers sit at the end of the chain. Their premium covers overhead — website infrastructure, payment processing, insurance on inventory, shipping logistics, compliance, and profit margin. Payment method also affects the final price: credit card orders typically carry a higher premium than bank wire or check payments because dealers absorb processing fees of 2-3%.
The result: when you see a $138.22 premium on a Gold Eagle, you’re looking at the accumulated cost of mining, refining, minting, Mint markup, authorized purchaser margin, and dealer margin stacked together.
Why Premiums Vary by Product Type
Not all bullion products carry the same premium. The spread across categories is wide. Here is what average premiums look like across the major product types right now:
Category
Average Premium
Status
Platinum Bars
27.76%
—
Platinum Coins
22.99%
—
Silver Coins
17.50%
HIGH
Silver Bars
9.17%
HIGH
Gold Coins
7.09%
HIGH
Gold Bars
7.04%
NORMAL
Junk Silver
2.12%
NORMAL
Several forces drive these differences.
Fabrication costs are roughly fixed in dollar terms. It costs a mint or refiner a similar dollar amount to stamp a 1 oz silver coin as it does a 1 oz gold coin. But that fixed cost is a much larger percentage of a $60 silver coin than a $4,115 gold coin. This is the main reason silver premiums run higher in percentage terms than gold premiums. A $5 fabrication cost on a 1 oz silver product is 8.3% of melt value; the same $5 on a 1 oz gold product is 0.12%.
Government-minted coins carry higher premiums than generic bars and rounds. The US Mint’s wholesale markup is baked in before a Gold Eagle or Silver Eagle ever reaches a dealer. A 1 oz American Silver Eagle carries a 15.63% premium ($9.69) while a generic 1 oz silver round sits at 7.78% ($4.83). You pay extra for the sovereign mint’s guarantee of weight and purity, legal tender status, and wider recognition in the secondary market.
Size matters. Larger bars carry lower percentage premiums because the fixed costs of production are spread across more metal. A 1 oz silver bar carries an 8.25% premium. A 10 oz silver bar drops to 6.29%. A 100 oz silver bar falls to 4.37%. The same pattern holds in gold: a 1 oz gold bar runs 4.07% while a 10 oz gold bar drops to 2.15%.
Platinum sits at the top of the premium table because production volumes are a fraction of gold and silver. Fewer refiners produce platinum bullion, dealer inventories are smaller, and the market is less liquid. A 1 oz American Platinum Eagle carries a 13.18% premium ($215.69), and even a generic 1 oz platinum bar runs 8.08% ($132.35).
Why Premiums Change Over Time
Premiums are not static. They expand and contract based on supply and demand conditions that are entirely separate from spot price movements.
Supply disruptions push premiums up fast. When the US Mint suspends Silver Eagle production or rations output — as it has done repeatedly — dealer inventories tighten and the premium on remaining stock jumps. The COVID-19 period from 2020 through 2022 was a textbook case: Silver Eagle premiums spiked above 50% as mint closures, shipping delays, and surging retail demand collided. Spot silver didn’t move nearly as much as premiums did.
Demand surges have the same effect. Banking crises, geopolitical instability, and inflation fears all drive retail buying. When the Silicon Valley Bank collapse hit in March 2023, premiums on silver coins jumped within days as buyers rushed to physical metal. The spot price reaction was modest; the premium reaction was immediate.
US Mint wholesale price changes ripple through the market. Each time the Mint raises its markup to authorized purchasers, retail premiums adjust upward within weeks. These are not temporary spikes — they are permanent resets to a higher baseline.
Seasonal patterns also show up in the data. Year-end and January buying driven by IRA funding deadlines creates predictable demand. Summer months tend to see softer demand and narrower premiums on some products.
These cycles become visible when you track premiums over time. A spot chart tells you what metal is worth on paper. A premium history chart tells you what it actually costs to buy.
How to Read Premium Data
Premium can be expressed two ways: as a dollar amount or as a percentage. Both are useful, but percentage is better for comparison and historical analysis.
Dollar premium tells you the absolute cost above melt. A $138.22 premium on a Gold Eagle is concrete — that is the per-coin cost above spot. But dollar premiums shift with spot price even when the market hasn’t changed. If gold rises $100 and the dealer still charges the same markup, the dollar premium stays flat while the percentage premium drops.
Percentage premium normalizes for spot price changes. When you see that Gold Eagle premiums are at 3.32% today versus 4.5% six months ago, you know the actual buy-in cost relative to metal value has dropped — regardless of where spot went in between. This makes percentage premium the right metric for tracking trends over time.
On FBP’s premium history pages, each category and flagship product shows current premium data alongside historical charts. Products are tagged with a status — HIGH or NORMAL — based on where today’s premium sits relative to historical ranges. A HIGH tag means the current premium is elevated compared to the product’s own history. A NORMAL tag means it falls within typical ranges.
Trend indicators for 14-day and 30-day periods show the direction premiums are moving. A premium that is HIGH but trending down may be worth watching — it could signal a return to normal ranges. A premium that is NORMAL but trending up could indicate tightening supply before a spike becomes visible in the headline number.
Why Premium Matters More Than Spot Price
Most bullion buyers fixate on spot price. They check gold at $4,115 or silver at $60 and decide whether to buy based on whether the spot price feels high or low. This misses half the equation.
Your actual cost per ounce is spot plus premium. Two buyers purchasing the same type of coin at different premium environments will have very different cost bases even if spot price is identical. A buyer who picks up Silver Eagles at a 15% premium pays $69.35 per ounce at today’s spot. A buyer who waits for premiums to normalize to 10% pays $66.33 — a $3.02 per-ounce savings on the same product at the same spot price.
The comparison works across products, too. A 1 oz American Gold Eagle at 3.32% premium costs $4,253.43. A 1 oz Canadian Gold Maple Leaf at 3.22% premium costs $4,248.93 — $4.50 less for the same amount of gold. A 1 oz gold bar at 4.07% costs $4,284.59 — more than either sovereign coin right now, which is unusual and signals tight bar supply or elevated dealer margins on bars. Comparing premiums across products shows you where the best prices relative to spot actually are.
For long-term holders, the round-trip cost matters most. You pay a premium when you buy, and you accept a spread below spot when you sell. Sovereign coins from major government mints — Gold Eagles, Gold Maples, Gold Buffalos — typically command tighter buyback spreads from dealers than generic bars or rounds. A Gold Eagle bought at 3.32% premium and sold back at 1% below spot has a round-trip cost of about 4.3%. A generic bar bought at 4.07% and sold at 2% below spot has a round-trip cost of about 6.1%. The product with the lower buy premium isn’t always the cheapest to own.
How FindBullionPrices Tracks Premiums
FBP publishes daily premium data for every major bullion product category. The premium history tool shows category-level averages and individual flagship product premiums with historical charts across 30, 90, 180, and 365-day windows.
Each category page breaks down the average premium for that product type and shows how it has moved over time. Individual product charts — Gold Eagles, Silver Eagles, 1 oz bars, 10 oz bars — let you see exactly when premiums spiked, when they compressed, and where they sit today relative to their own history.
No other bullion comparison site publishes this data. Most comparison sites show you today’s price and stop there. FBP tracks and charts the premium component separately, so you can see whether today’s price reflects a normal premium environment or an inflated one. That distinction is the difference between buying at fair value and overpaying for the same metal.
If you’re buying bullion, check the current premium history data before you place an order. Look at the category-level premium, check the HIGH/NORMAL status, and compare the trend direction. Then use the closest-to-spot pages to find the dealers offering the tightest premiums right now. Spot price is the starting point. Premium is what you actually control.